Actions
Bug #219
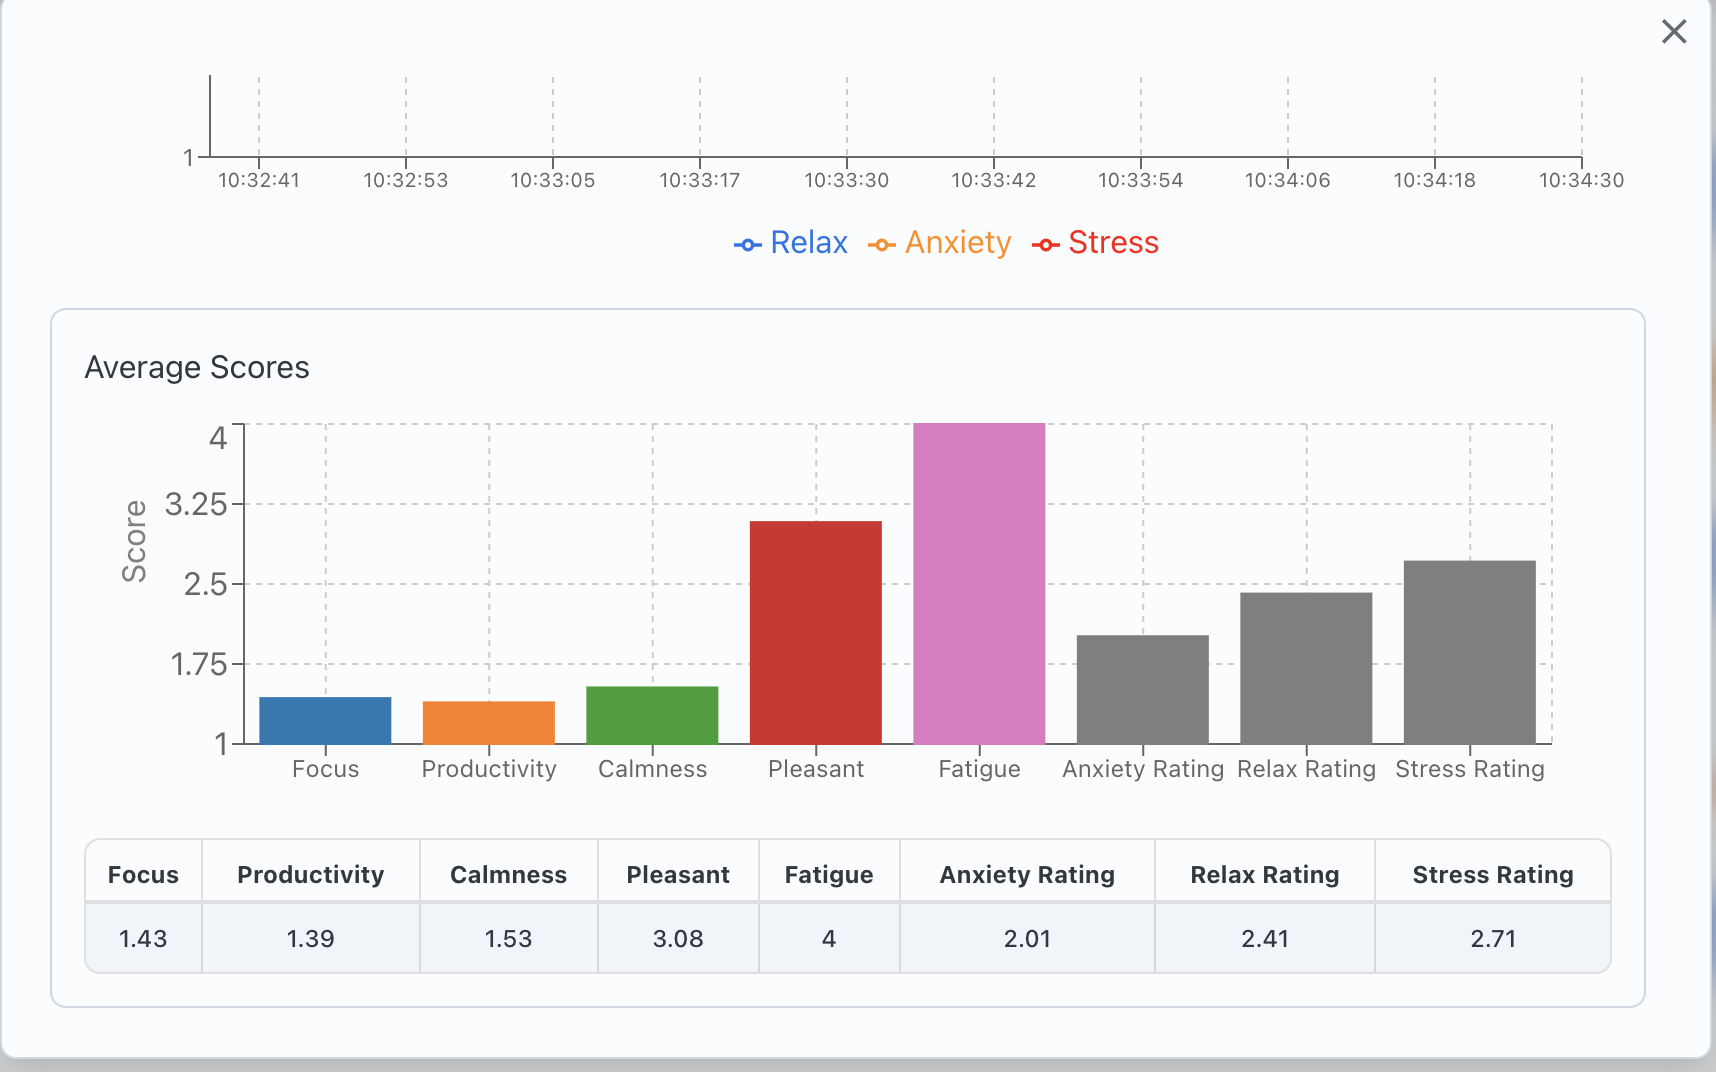
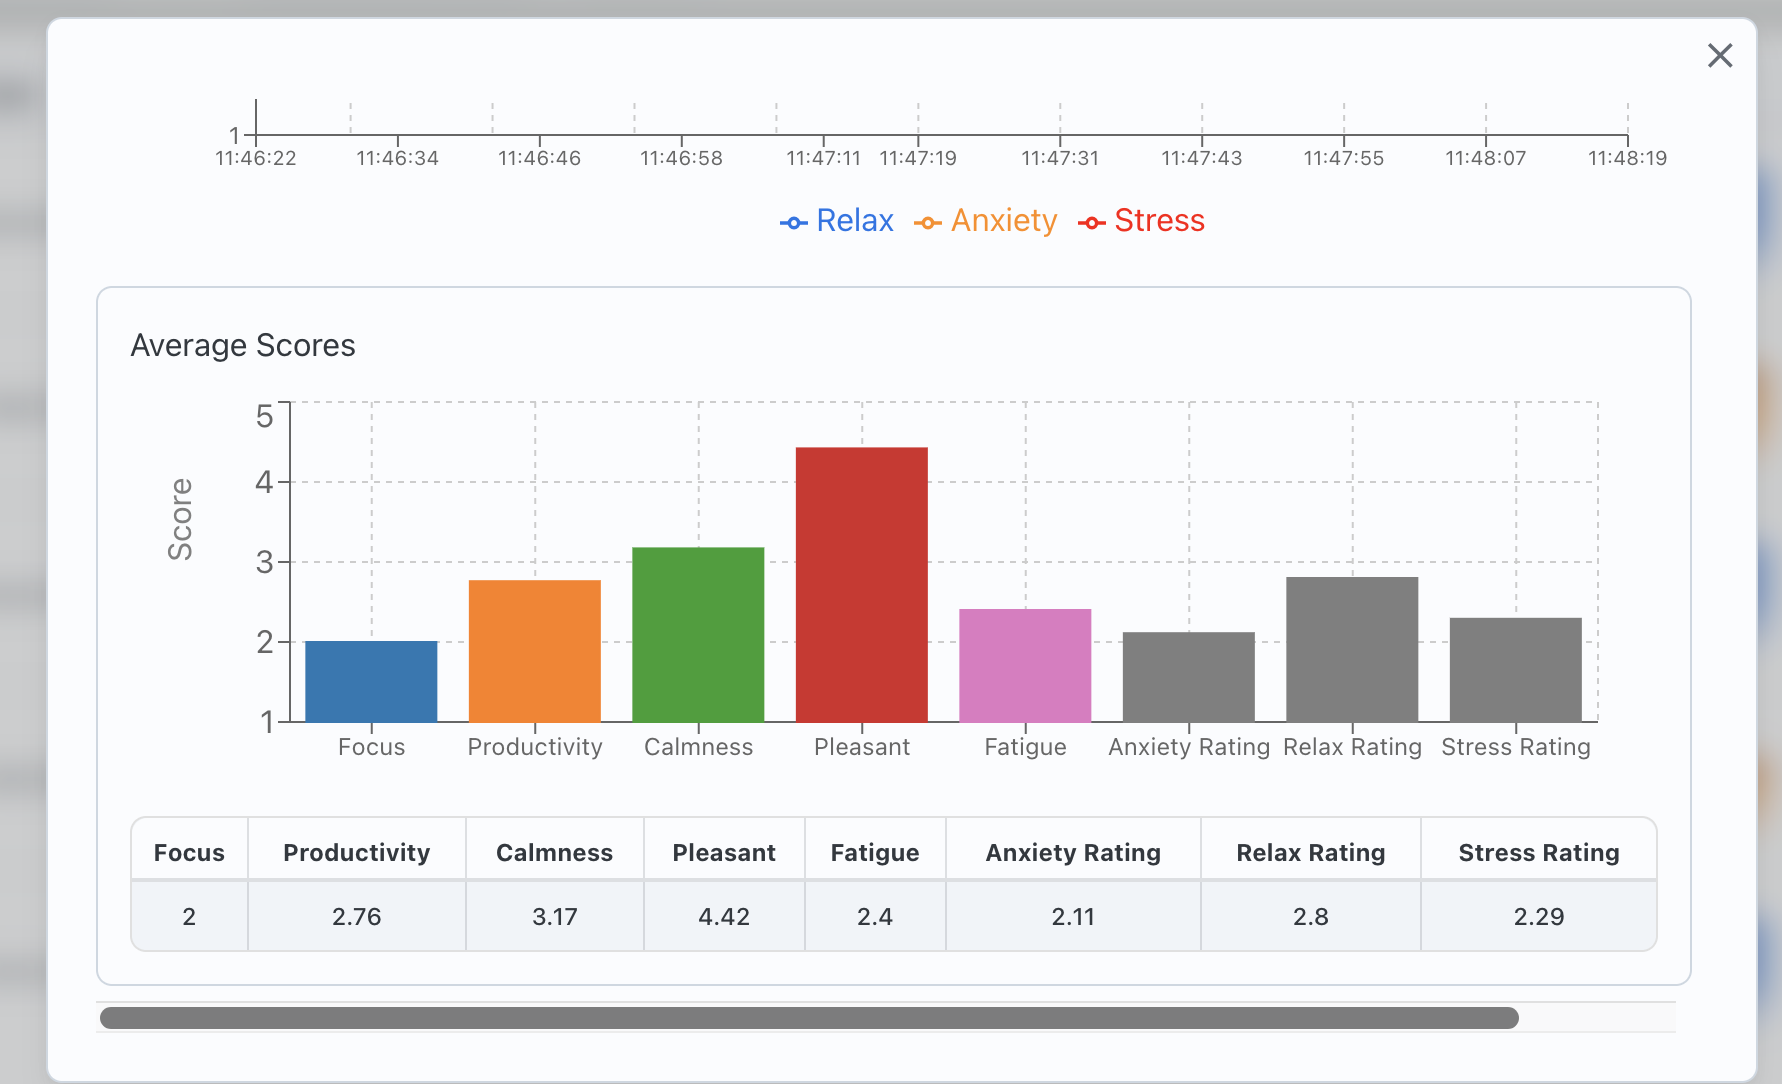
closedFunctional Defect: In result PDF, Y axis of Focus, productivity etc graph shows scale from 1-4 at some Test ID with (50899) and for some it shows 1-5(50897)
Start date:
12/05/2025
Due date:
% Done:
0%
Estimated time:
Description
In the result PDF, the Y-axis of the Focus, Productivity, etc. graphs shows a scale of 1–4 for some test IDs (e.g., 50899), while for others it shows 1–5 (e.g., 50897).
Files
Actions