Actions
Bug #205
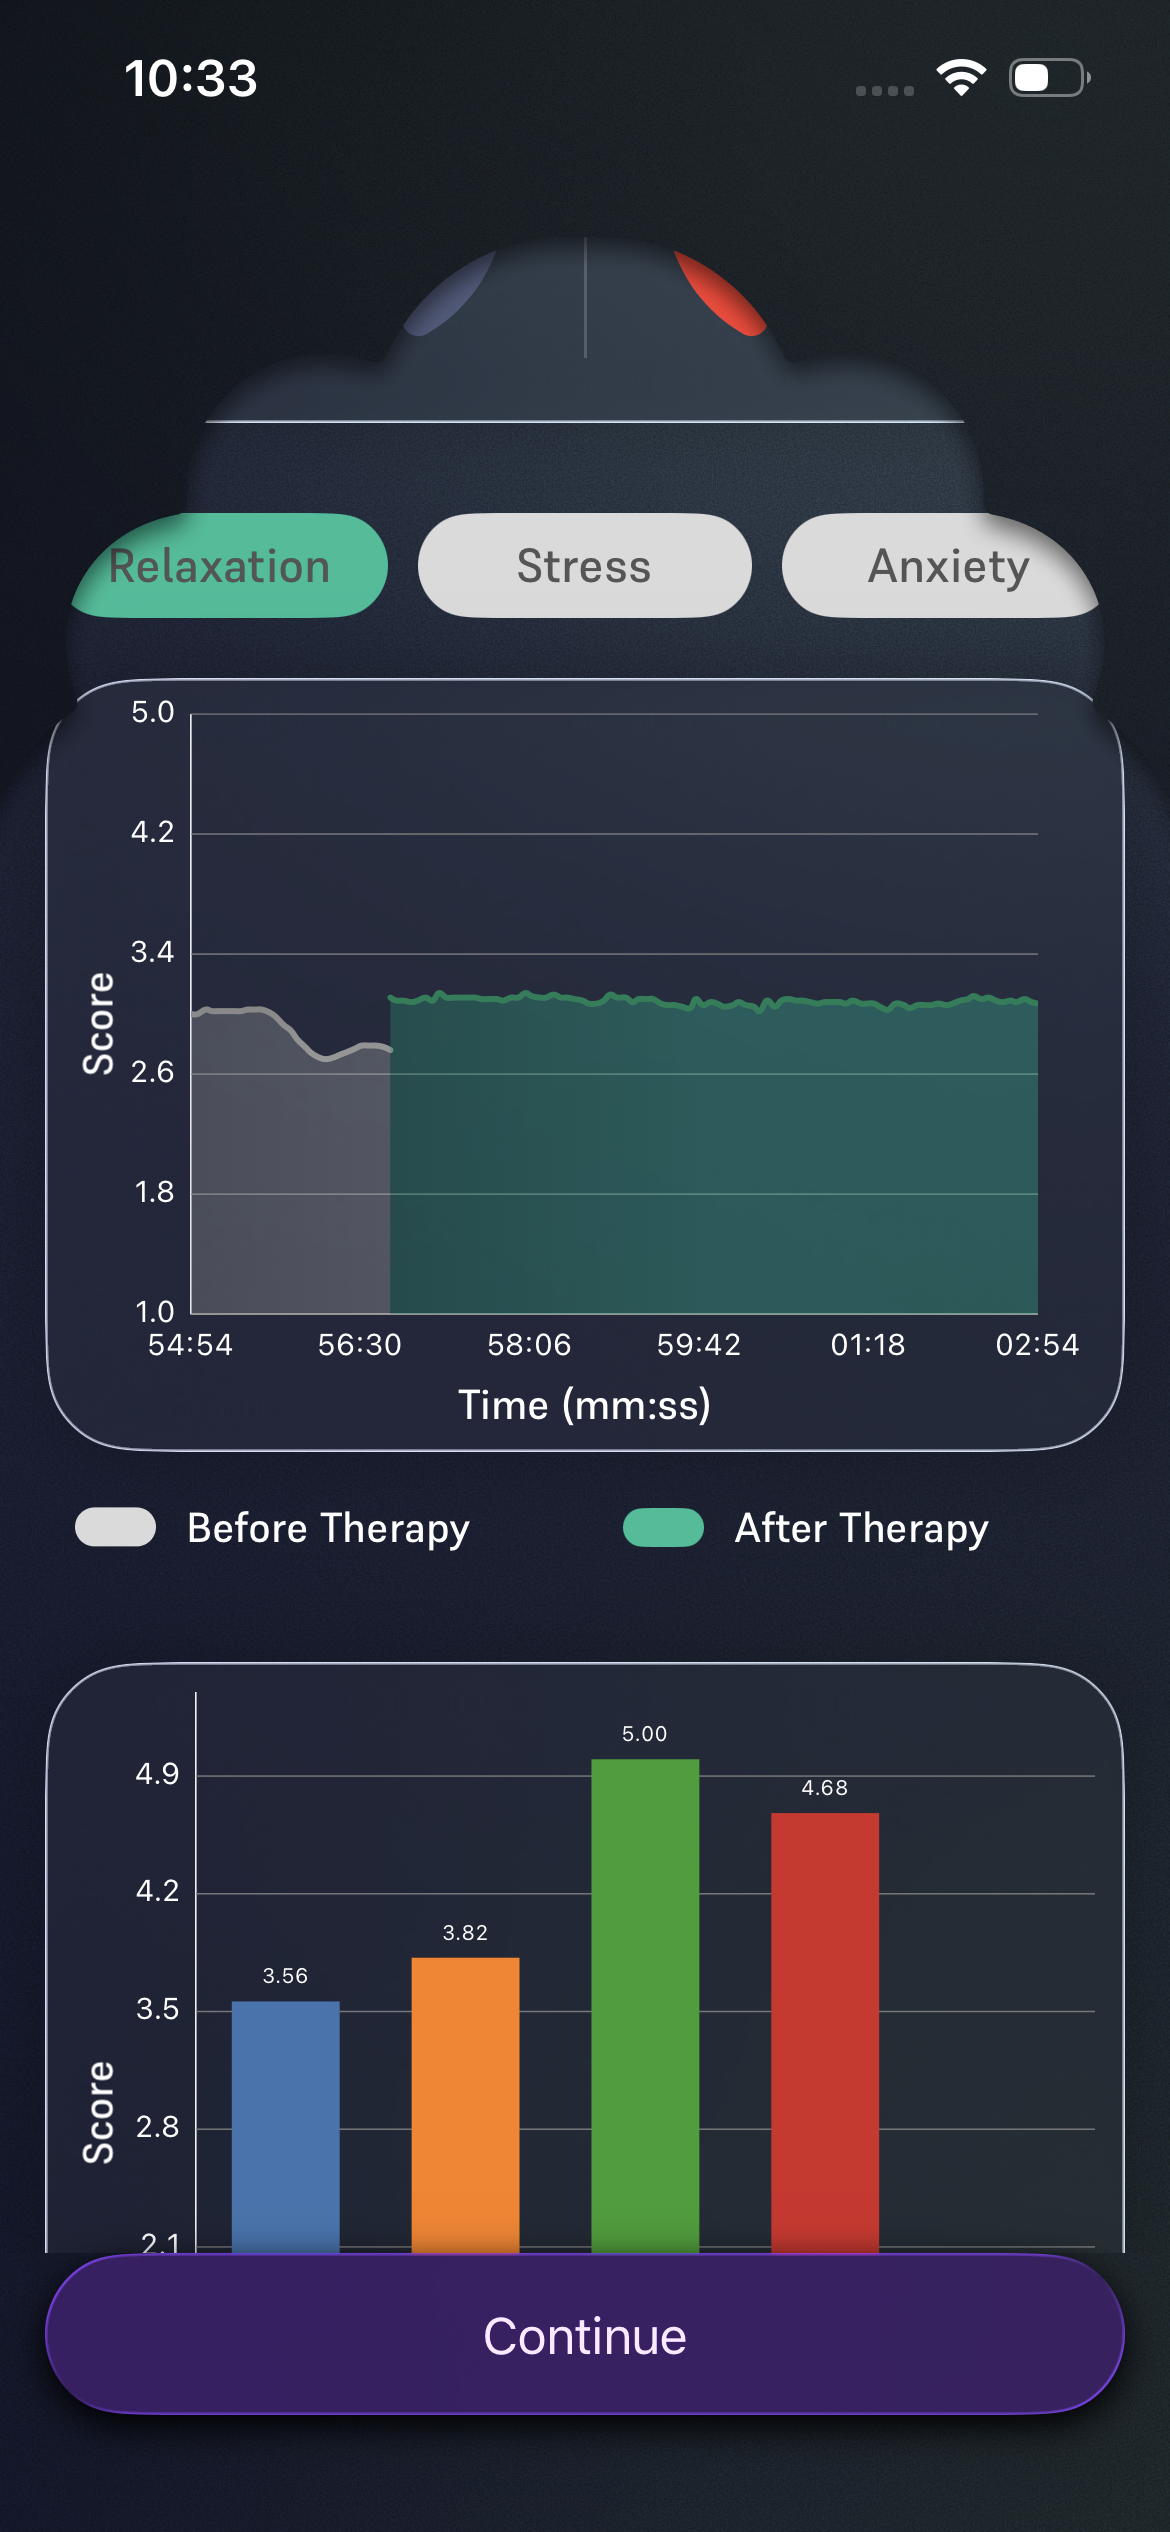
closedIncorrect X-axis Timing Display on Line Graph (Stress, Anxiety, Relaxation) in Analysis Page After Therapy(IOS version 1.63)
Start date:
12/04/2025
Due date:
% Done:
0%
Estimated time:
Description
On the Analysis page, after completing a therapy session, the line graph displaying Stress, Anxiety, and Relaxation levels shows incorrect timing values on the X-axis.
The timestamps appear not matching actual recorded times (exact issue as observed).
Steps to Reproduce:
Complete a therapy session.
Navigate to the Analysis page.
View the line graph for Stress, Anxiety, and Relaxation.
Observe the timing shown on the X-axis.
Files
Actions